Changelog
Fixed custom SQL date picker inconsistencies
We've resolved a bug in Log Explorer that caused inconsistencies between the custom SQL date field filters and the date picker dropdown. Previously, users attempting to filter logs based on a custom date field via a SQL query sometimes encountered unexpected results or mismatching dates when using the interactive date picker.
This fix ensures that the custom SQL date field filters now align correctly with the selection made in the date picker dropdown, providing a reliable and predictable filtering experience for your log data. This is particularly important for users creating custom log views based on time-sensitive fields.
Log Explorer adds 14 new datasets
We've significantly enhanced Log Explorer by adding support for 14 additional Cloudflare product datasets.
This expansion enables Operations and Security Engineers to gain deeper visibility and telemetry across a wider range of Cloudflare services. By integrating these new datasets, users can now access full context to efficiently investigate security incidents, troubleshoot application performance issues, and correlate logged events across different layers (like application and network) within a single interface. This capability is crucial for a complete and cohesive understanding of event flows across your Cloudflare environment.
The newly supported datasets include:
Dns_logsNel_reportsPage_shield_eventsSpectrum_eventsZaraz_events
Audit LogsAudit_logs_v2Biso_user_actionsDNS firewall logsEmail_security_alertsMagic Firewall IDSNetwork AnalyticsSinkhole HTTPipsec_logs
You can now use Log Explorer to query and filter with each of these datasets. For example, you can identify an IP address exhibiting suspicious behavior in the FW_event logs, and then instantly pivot to the Network Analytics logs or Access logs to see its network-level traffic profile or if it bypassed a corporate policy.
To learn more and get started, refer to the Log Explorer documentation and the Cloudflare Logs documentation.
Resize your custom SQL window in Log Explorer
We're excited to announce a quality-of-life improvement for Log Explorer users. You can now resize the custom SQL query window to accommodate longer and more complex queries.
Previously, if you were writing a long custom SQL query, the fixed-size window required excessive scrolling to view the full query. This update allows you to easily drag the bottom edge of the query window to make it taller. This means you can view your entire custom query at once, improving the efficiency and experience of writing and debugging complex queries.
To learn more and get started, refer to the Log Explorer documentation.
Log Explorer now supports query cancellation
We're excited to announce that Log Explorer users can now cancel queries that are currently running.
This new feature addresses a common pain point: waiting for a long, unintended, or misconfigured query to complete before you can submit a new, correct one. With query cancellation, you can immediately stop the execution of any undesirable query, allowing you to quickly craft and submit a new query, significantly improving your investigative workflow and productivity within Log Explorer.
Log Explorer now shows query result distribution
We're excited to announce a new feature in Log Explorer that significantly enhances how you analyze query results: the Query results distribution chart.
This new chart provides a graphical distribution of your results over the time window of the query. Immediately after running a query, you will see the distribution chart above your result table. This visualization allows Log Explorer users to quickly spot trends, identify anomalies, and understand the temporal concentration of log events that match their criteria. For example, you can visually confirm if a spike in traffic or errors occurred at a specific time, allowing you to focus your investigation efforts more effectively. This feature makes it faster and easier to extract meaningful insights from your vast log data.
The chart will dynamically update to reflect the logs matching your current query.
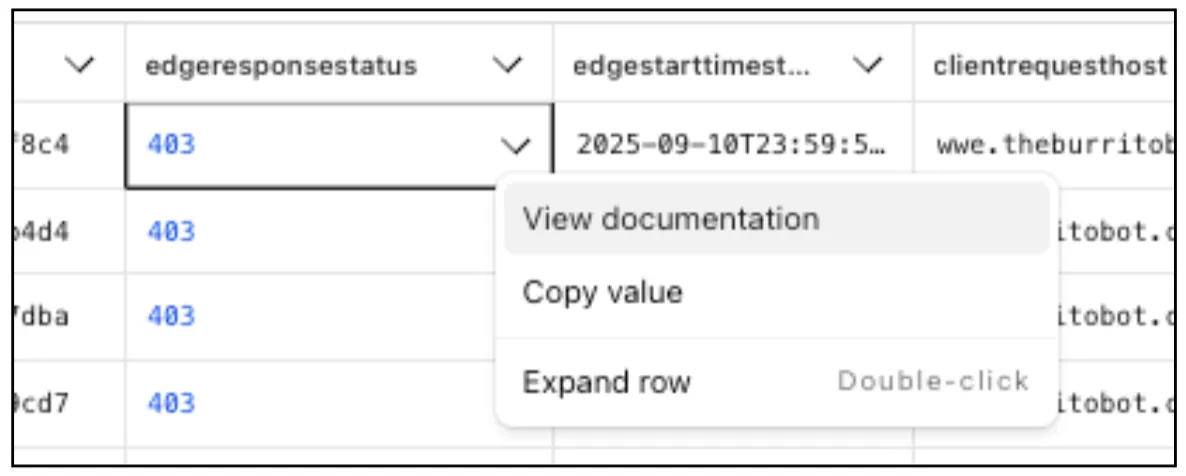
Contextual pivots
Directly from Log Search results, customers can pivot to other parts of the Cloudflare dashboard to immediately take action as a result of their investigation.
From the http_requests or fw_events dataset results, right click on an IP Address or JA3 Fingerprint to pivot to the Investigate portal to lookup the reputation of an IP address or JA3 fingerprint.

Easily learn about error codes by linking directly to our documentation from the EdgeResponseStatus or OriginResponseStatus fields.
From the gateway_http dataset, click on a policyid to link directly to the Zero Trust dashboard to review or make changes to a specific Gateway policy.

New results table view
The results table view of Log Search has been updated with additional functionality and a more streamlined user experience. Users can now easily:
- Remove/add columns.
- Resize columns.
- Sort columns.
- Copy values from any field.

Logging headers and cookies using custom fields
Log Explorer now supports logging and filtering on header or cookie fields in the http_requests dataset.
Create a custom field to log desired header or cookie values into the http_requests dataset and Log Explorer will import these as searchable fields. Once configured, use the custom SQL editor in Log Explorer to view or filter on these requests.
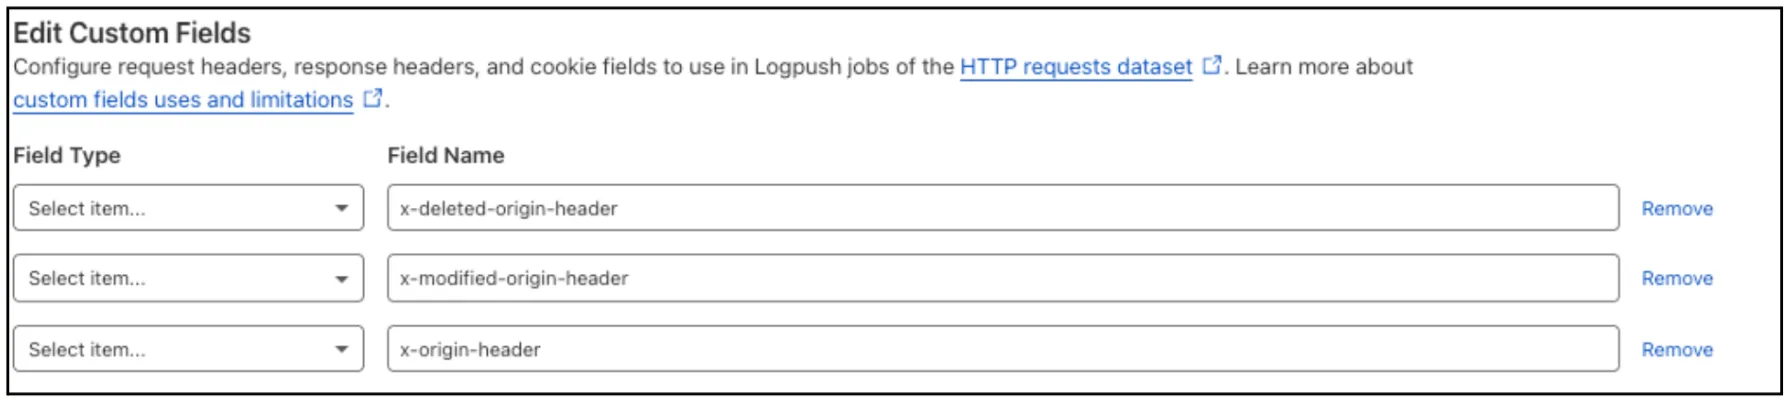
For more details, refer to Headers and cookies.
Extended retention
Customers can now rely on Log Explorer to meet their log retention compliance requirements.
Contract customers can choose to store their logs in Log Explorer for up to two years, at an additional cost of $0.10 per GB per month. Customers interested in this feature can contact their account team to have it added to their contract.
Usage tracking
Log Explorer customers can now monitor their data ingestion volume to keep track of their billing. Monthly usage is displayed at the top of the Log Search and Manage Datasets screens in Log Explorer.

Log Explorer is GA
Log Explorer is now GA, providing native observability and forensics for traffic flowing through Cloudflare.
Search and analyze your logs, natively in the Cloudflare dashboard. These logs are also stored in Cloudflare's network, eliminating many of the costs associated with other log providers.

With Log Explorer, you can now:
- Monitor security and performance issues with custom dashboards – use natural language to define charts for measuring response time, error rates, top statistics and more.
- Investigate and troubleshoot issues with Log Search – use data type-aware search filters or custom sql to investigate detailed logs.
- Save time and collaborate with saved queries – save Log Search queries for repeated use or sharing with other users in your account.
- Access Log Explorer at the account and zone level – easily find Log Explorer at the account and zone level for querying any dataset.
For help getting started, refer to our documentation.
Was this helpful?
- Resources
- API
- New to Cloudflare?
- Directory
- Sponsorships
- Open Source
- Support
- Help Center
- System Status
- Compliance
- GDPR
- Company
- cloudflare.com
- Our team
- Careers
- © 2025 Cloudflare, Inc.
- Privacy Policy
- Terms of Use
- Report Security Issues
- Trademark